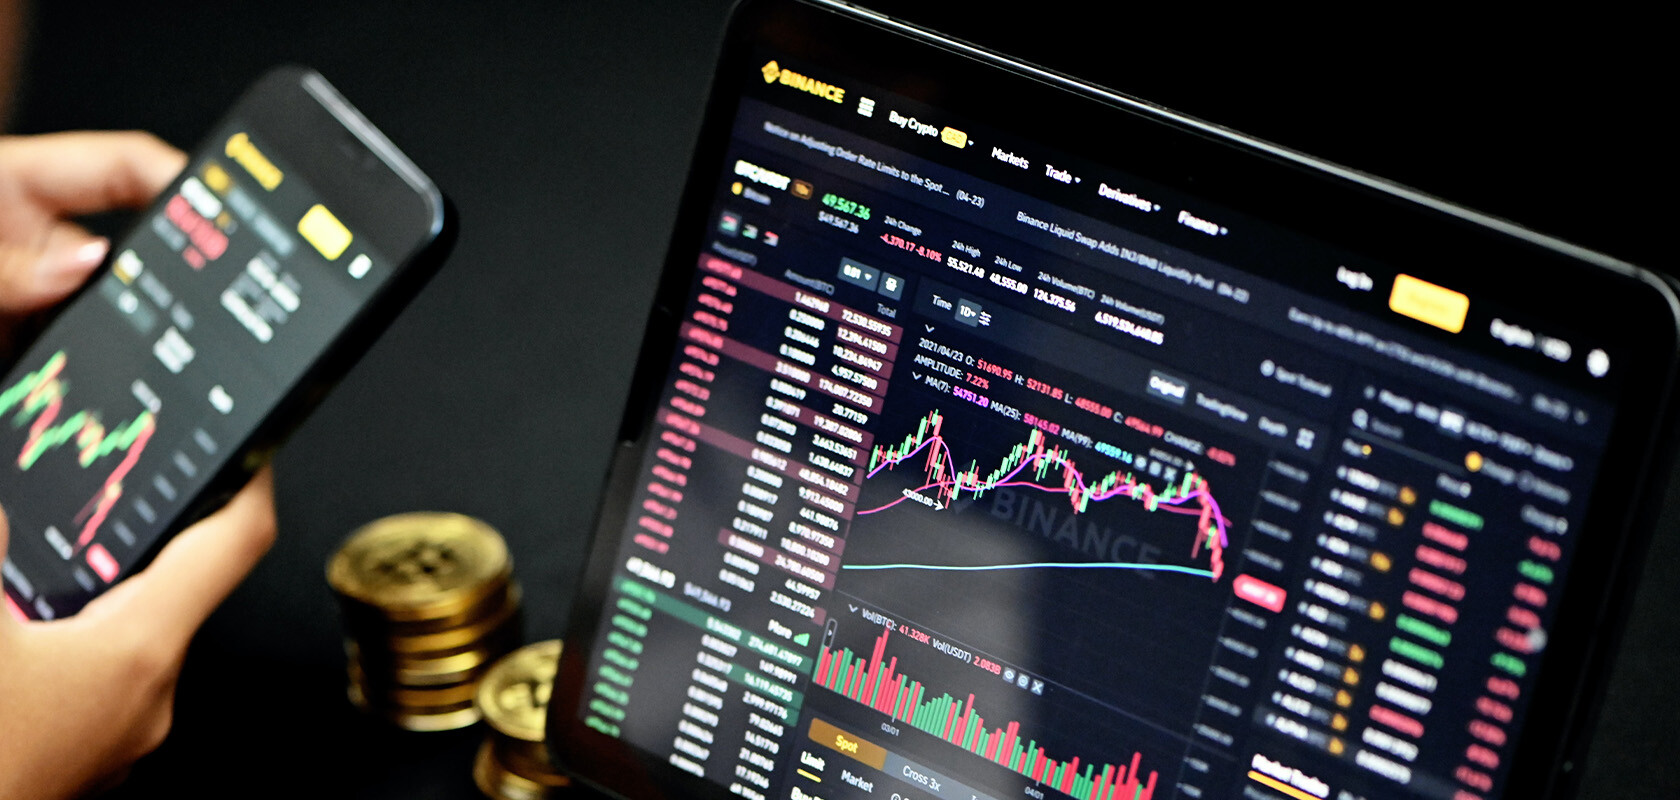
Charts are the main tool for technical analysis in financial markets. They help traders visualise price movements and identify trends and patterns. Choosing the right platform and chart type is crucial for successful analysis. In this article, we will look at different charting platforms and tools and how to select and use different chart types for market analysis.
Overview of charting platforms
There are many platforms that offer powerful tools for creating and analysing charts. Here are some of the best ones:
- TradingView: One of the most popular charting and analysis tools. TradingView offers a wide range of chart types, many indicators and technical analysis tools. The platform also supports interaction with other traders and publishing ideas.
- MetaTrader 4 and 5 (MT4/MT5): These platforms are popular among traders due to their functionality and convenience. They provide different types of charts, a wide range of indicators and the ability to automate trading through EAs.
- Thinkorswim: A platform from TD Ameritrade that offers advanced charting and analysis tools. Thinkorswim has powerful features for analysing stocks, options, futures and other financial instruments.
- eToro: A social trading platform that also provides good charting tools. eToro allows users to follow the actions of other traders and utilise their strategies.
Types of charts and how to use them
The type of chart type you choose depends on your trading and analysis style. The main chart types include:
- Candlestick charts: The most popular chart type among traders. Each “candlestick” represents a specific time frame (e.g. 1 hour), showing the open, close, high and low for that period. Candlestick charts help identify patterns and trends, such as a “takeover” or “doji”.
- Bar Charts: Similar to candlestick charts, but display data as vertical lines with horizontal bars indicating the open and close prices. Bar charts allow you to see the same data as candlestick charts, but may be less easy to visually analyse.
- Line Charts: Simple charts that show price changes over time in the form of a line. Line charts are useful for a general overview of trends, but do not provide detailed information about price fluctuations over a period of time.
How to choose the right chart type
The choice of chart type depends on your goals and trading style:
- For short-term traders (day trading and swing trading): Candlestick charts usually provide more information and make it easier to identify patterns and signals. The use of indicators such as moving averages or RSI can further enhance the analysis.
- For long-term investors: Line charts can be useful for assessing general trends and cycles over a longer time horizon. However, periodically switching to candlestick or bar charts can help identify important support and resistance levels.
Using tools for technical analysis
Charting platforms also offer various technical analysis tools such as:
- Indicators: Include moving averages, RSI, MACD and others that help evaluate trends and market conditions.
- Fibonacci: Tools for plotting Fibonacci levels to help identify potential support and resistance levels.
- Trend Lines: Used to visualise trend directions and possible reversal points.
Conclusion
Choosing and using the right charts and tools to analyse the market can greatly improve your trading. Platforms such as TradingView and MetaTrader provide powerful options for creating and analysing charts. The type of chart you choose depends on your trading style and goals. Use the available technical analysis tools to maximise your trading decisions.


